Quick Update on Bitcoin Trend Analysis 21 Dec 2016

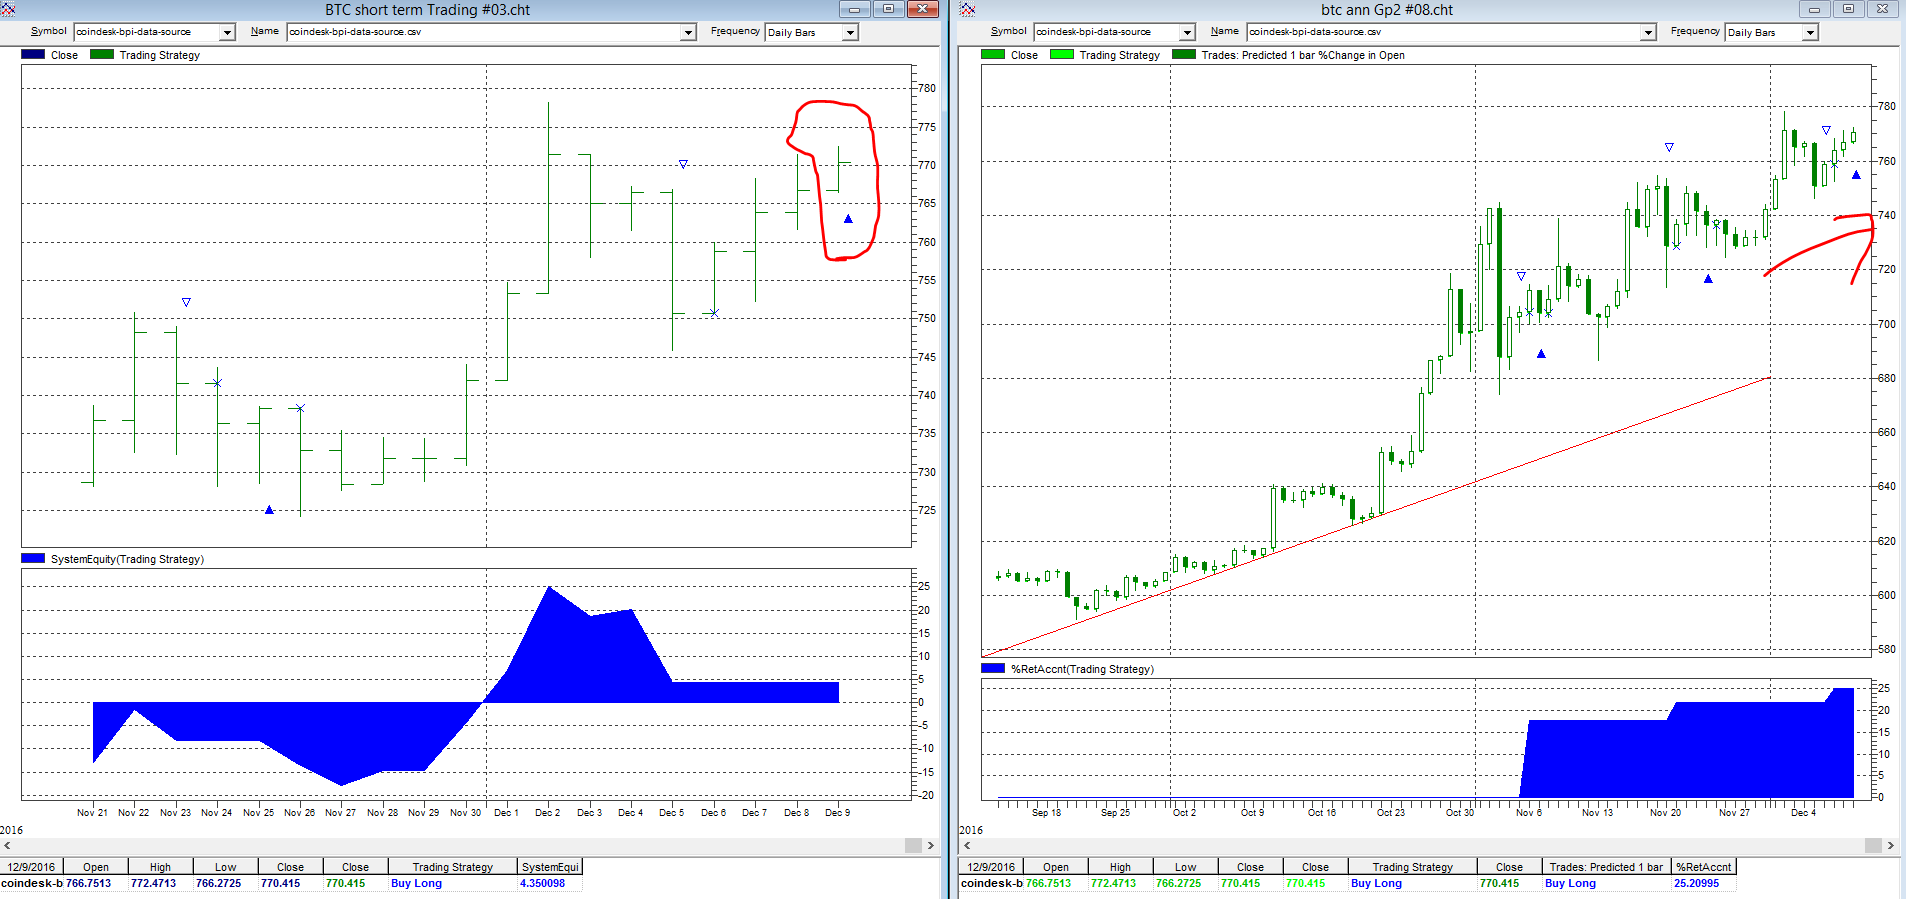
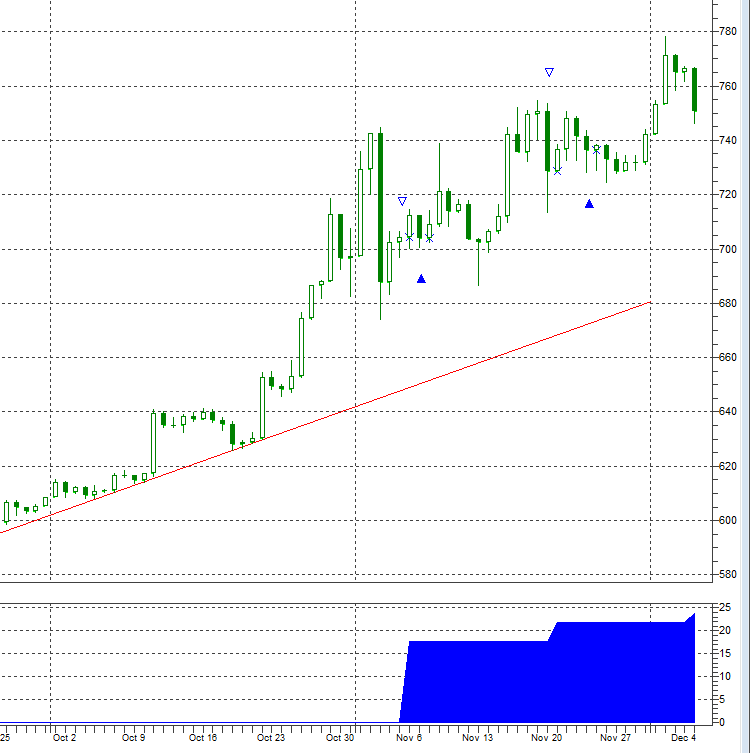
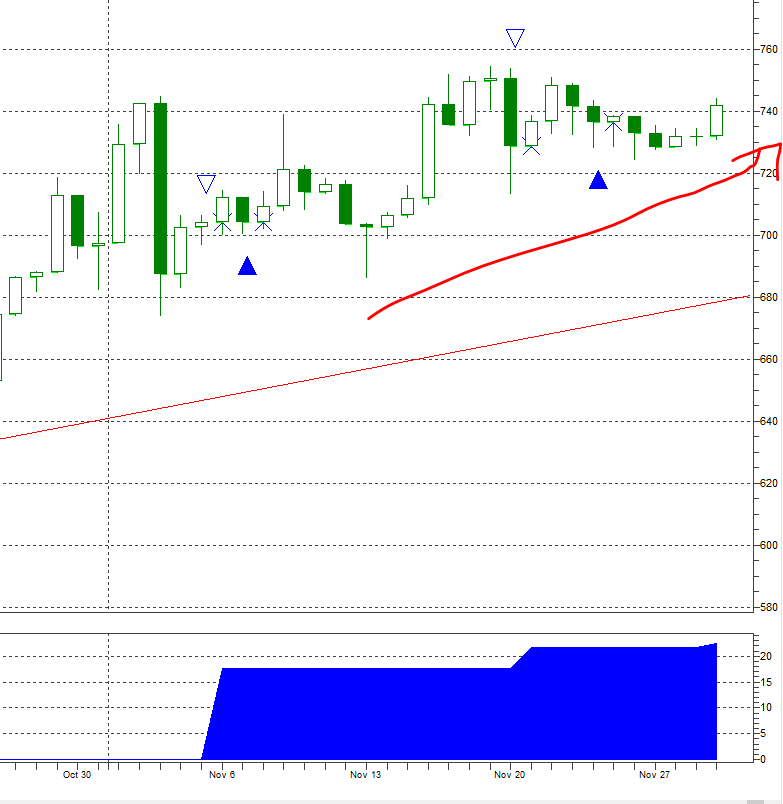
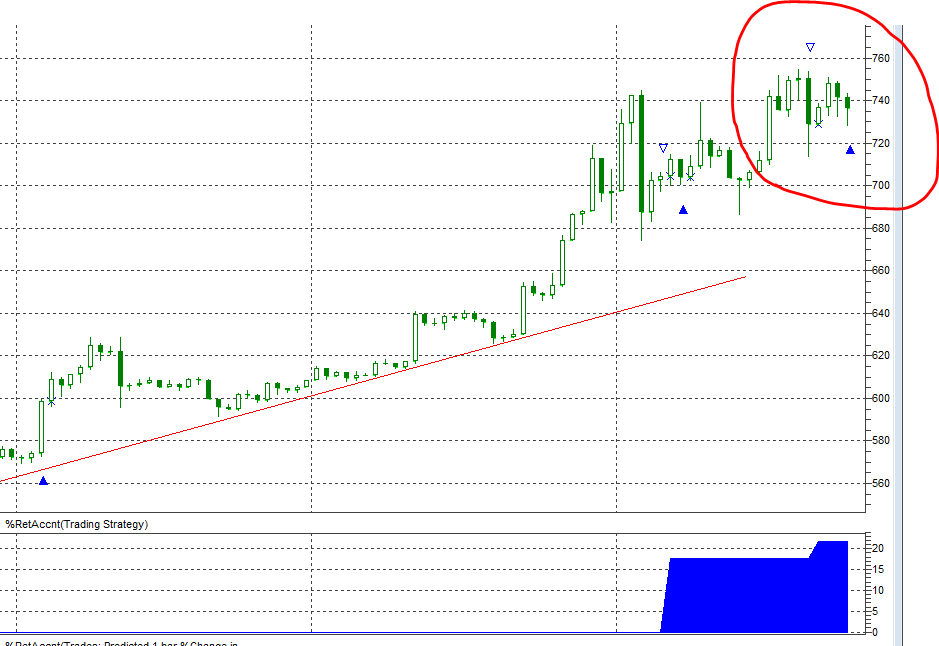
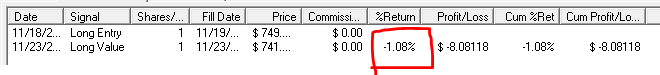
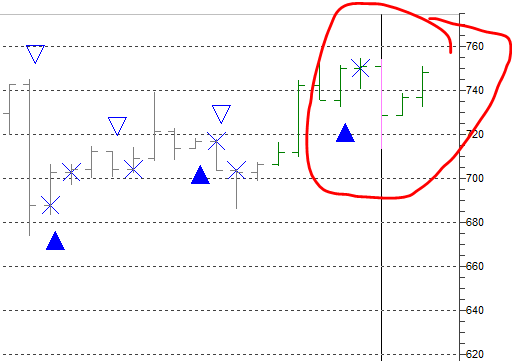
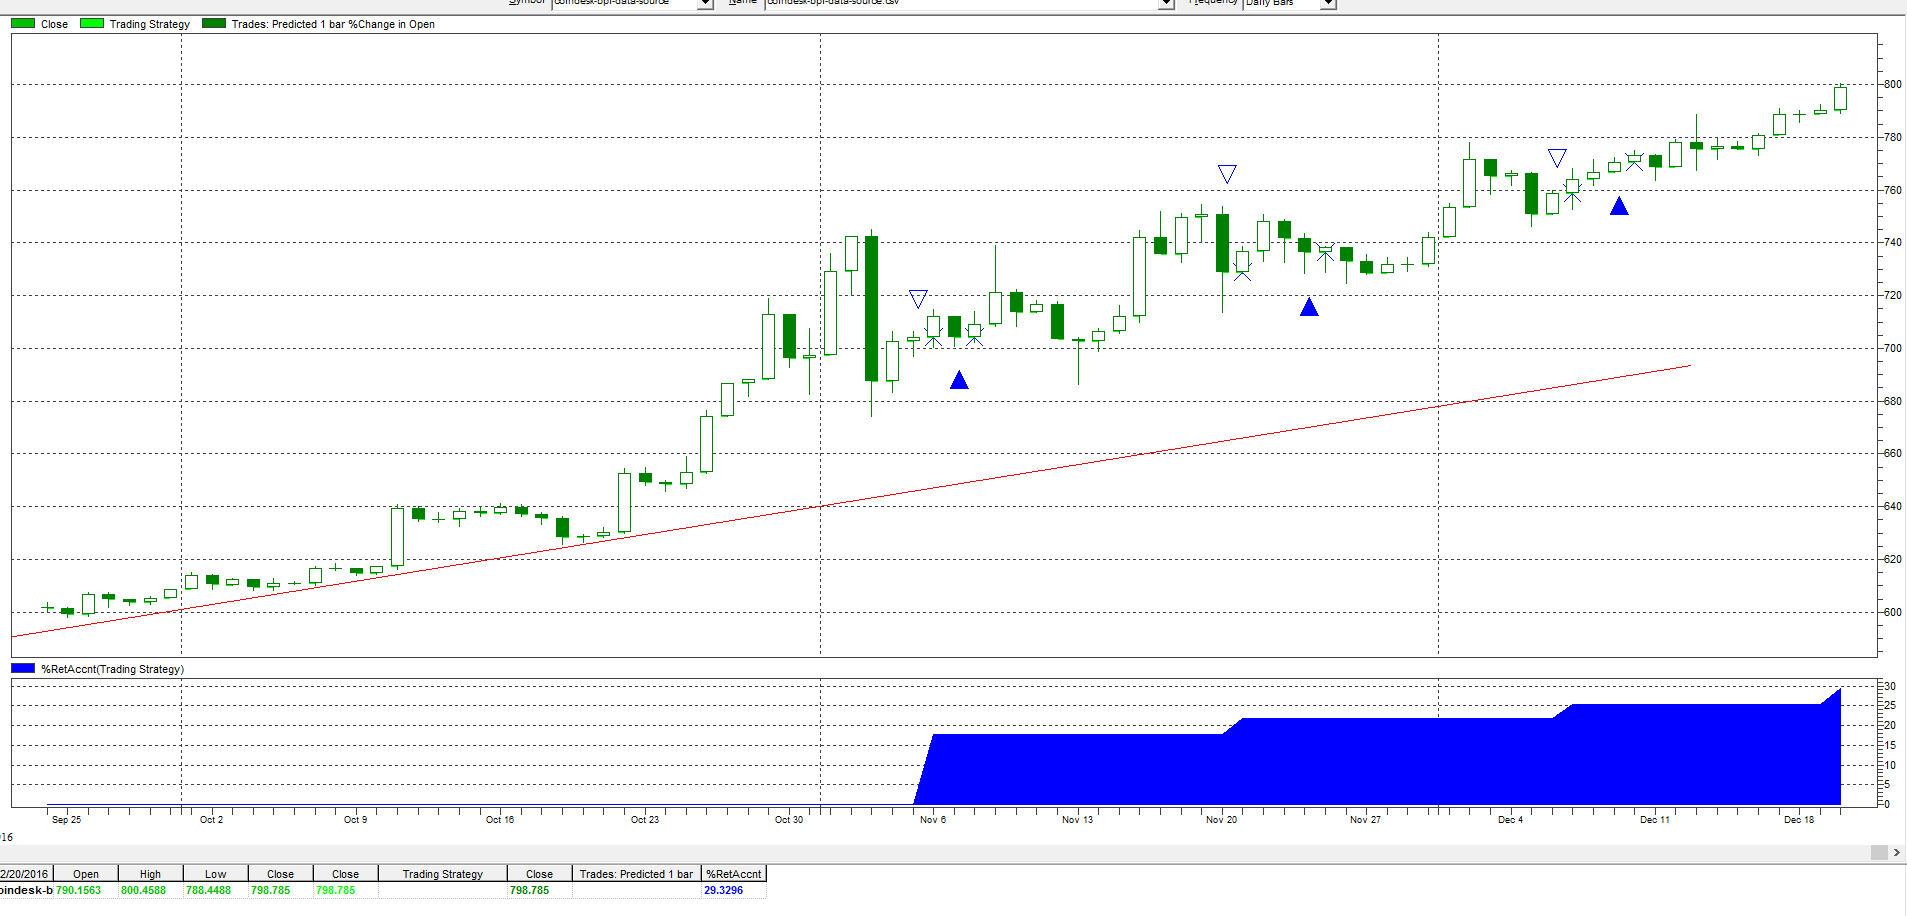
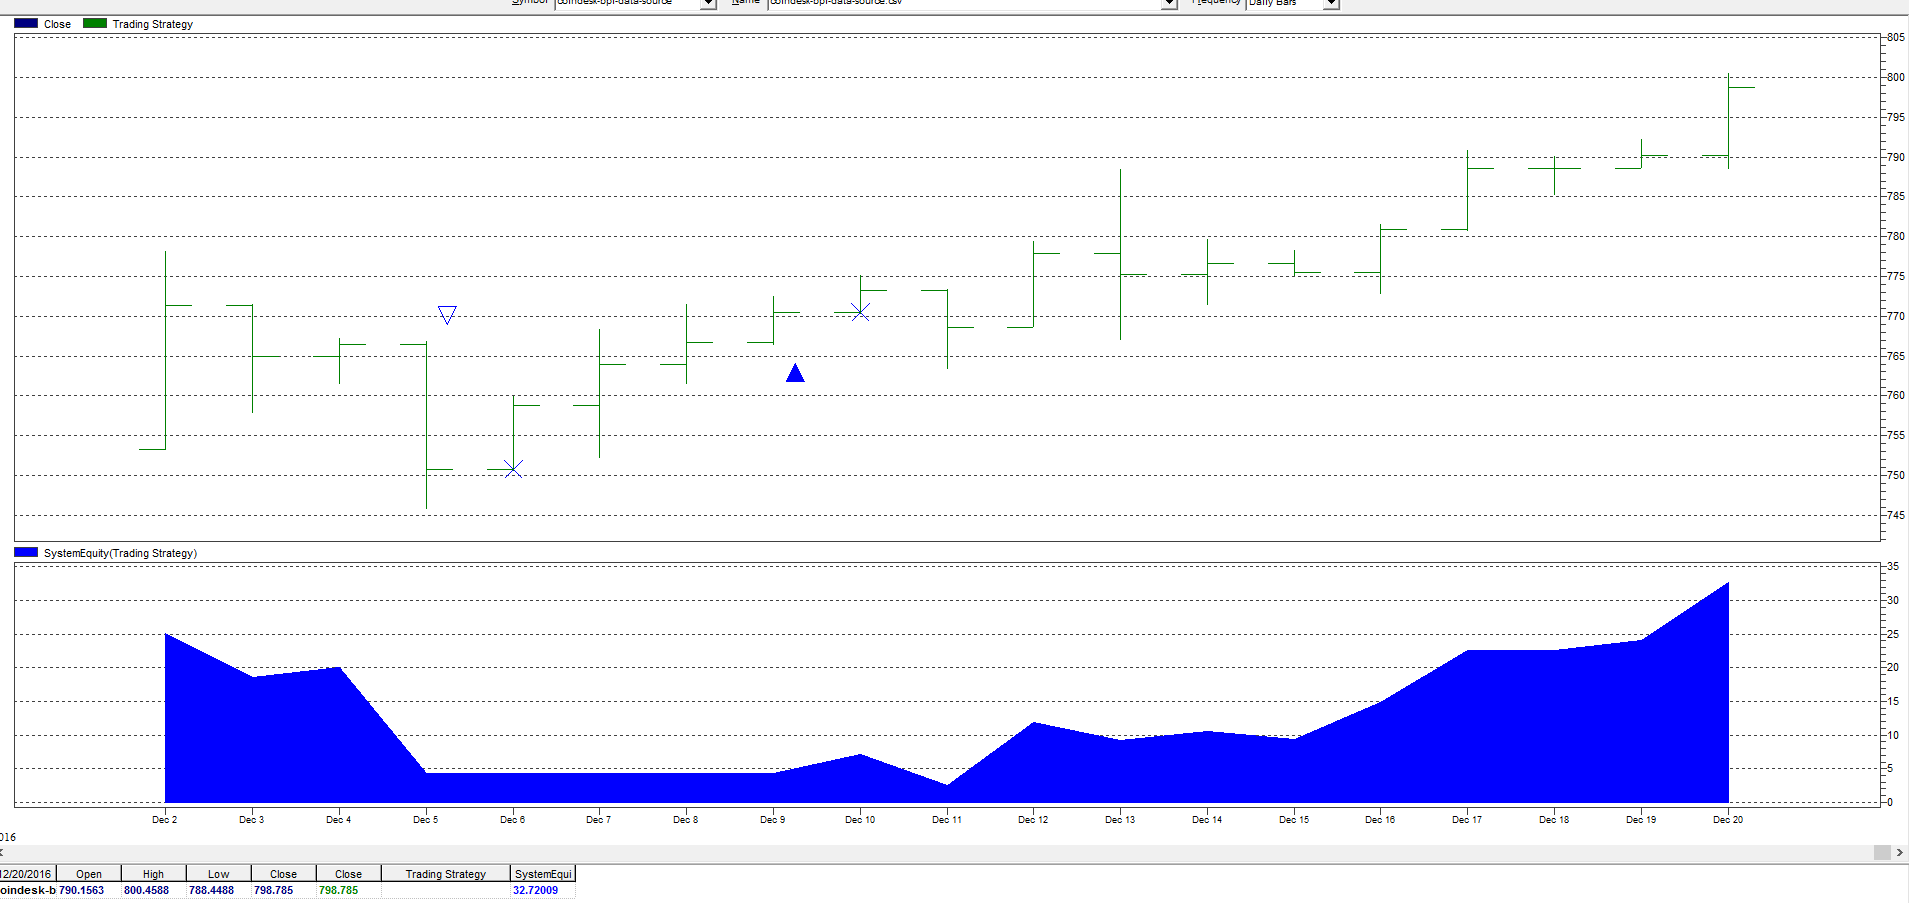
The Bitcoin price rises to $803 this morning. I have two trading system. One is called the Robot Dog “B” which is an A.I. made system for mid-term trend. There were three force EXIT signals on last two months and then a BUY signal was followed by each EXIT signal just for a few days. It confirmed that the BTC trend is in the upward mode.

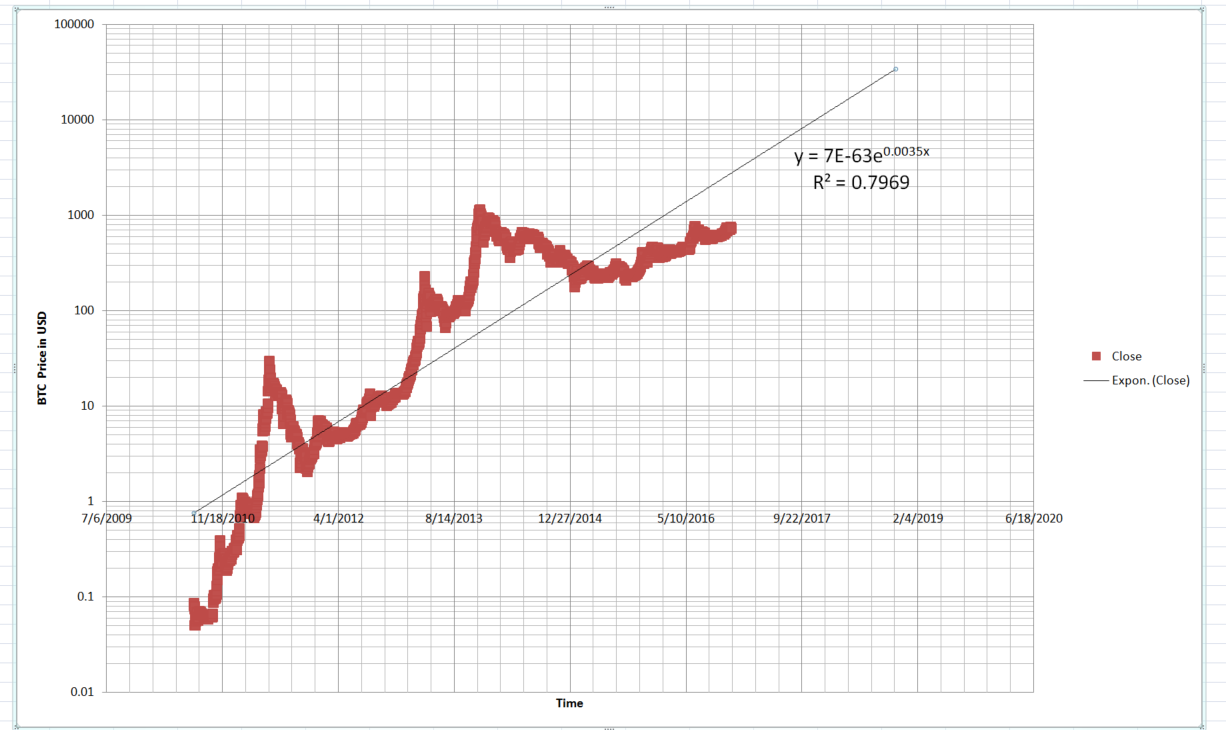
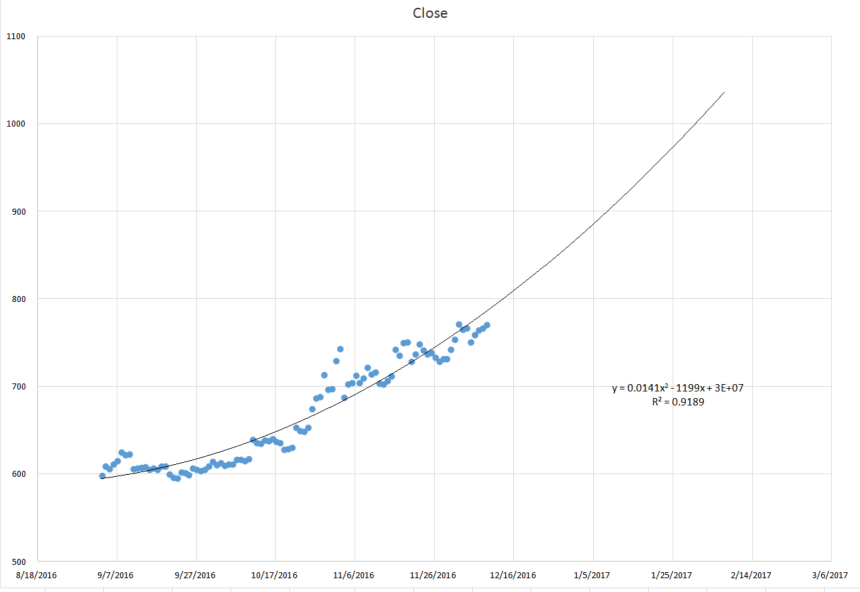
I used a regression method to project the price of BTC will go to about $1000 in END of Jan 2017. I hope the upward trend continue.

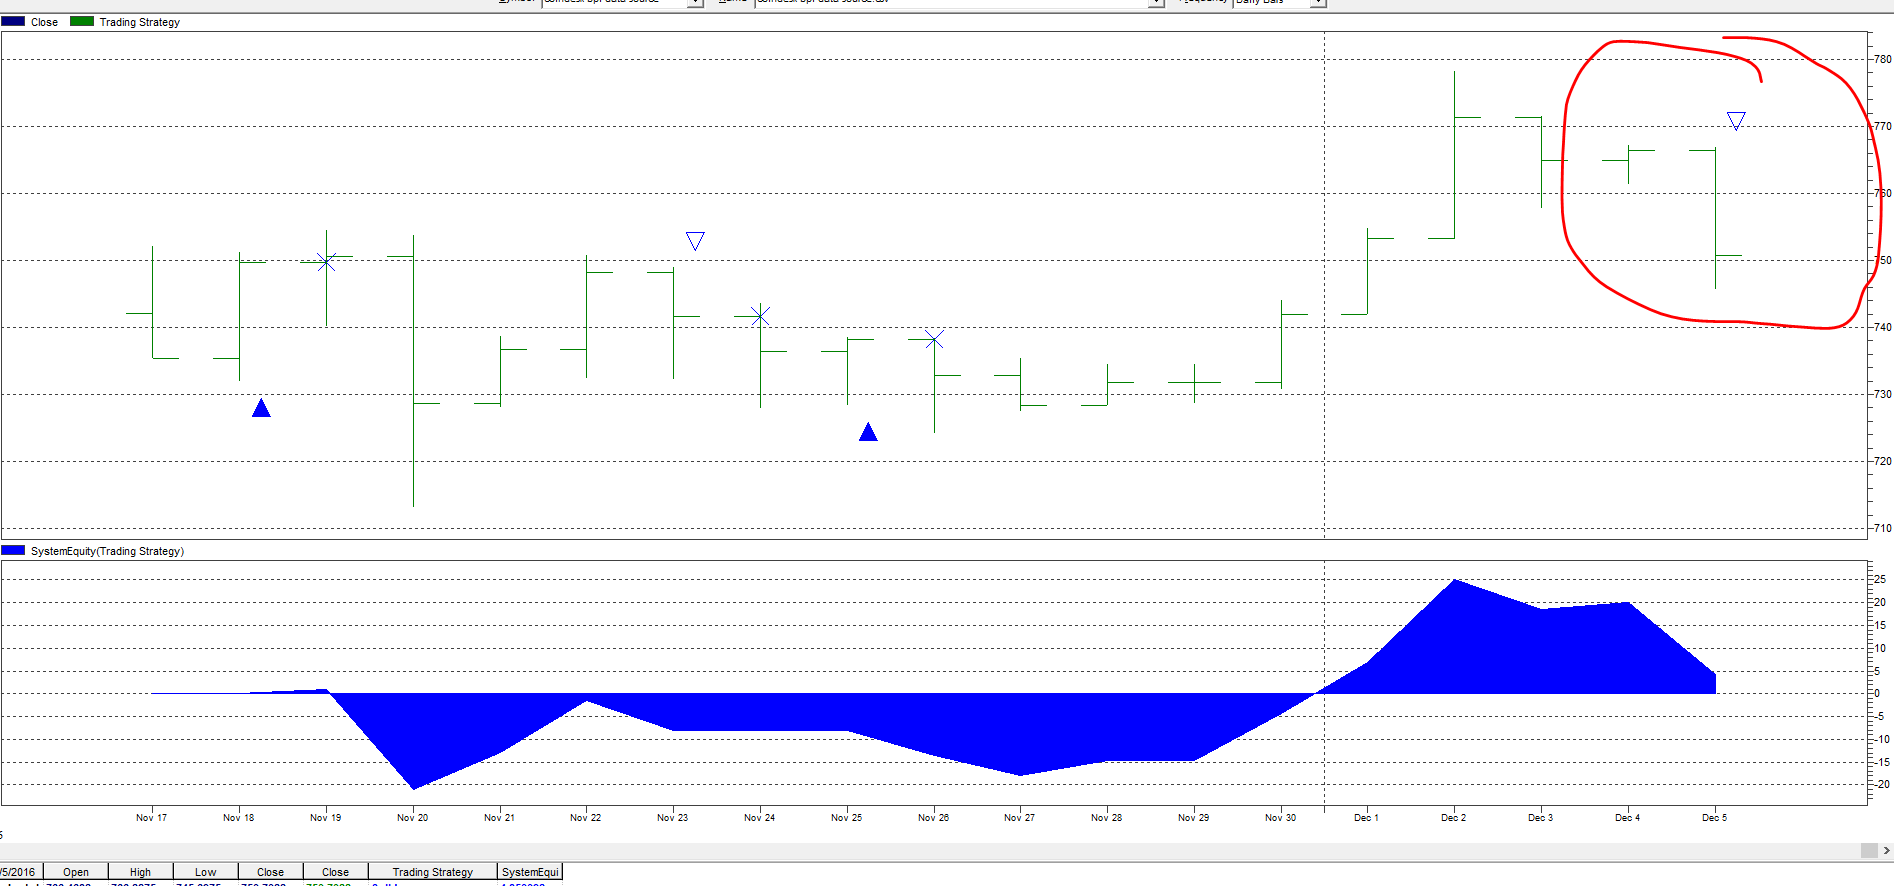
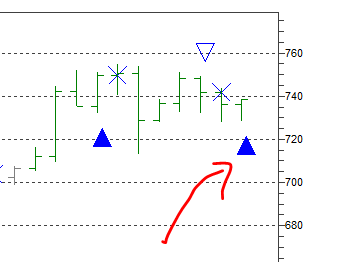
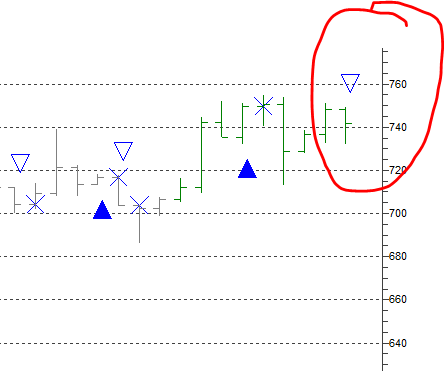
Another trading system called Robot Fighter “S” which is a short term day trading system which is in a beta testing stage (paper trading). It shows there is no EXIT signal in the past ten days which is also confirmed the upward price trend of BTC.

I assigned a programmer to work out the API linking to the bitcoin exchange and planned to finish in Feb 2017. I hope to have some real trading result to show you after Feb 2017.


$1000 per Bitcoin in Feb 2017 – Quick Update on Bitcoin Trend Analysis 10th Dec 2016

As shown in the about charts, Both trading systems of Robot Dog “B” and Robot Fighter “S” give BUY signal again.

I update the one-month data of the regression forecast model. It projects $1000 per bitcoin in Feb 2017.

Quick Update: Bitcoin Trend Analysis of Robot Fighter “S” and Robot Dog “B”

rfs-6-12-2016

There is an EXIT signal for Robot Fighter “S”.  The short term bitcoin trend is going down. The updated result are shown here.

rfs-6-12-2016-result

Robot Dog “B” does not have any EXIT signal. It indicates that the mid-term upward trend still continues.

rdb-6-12-2016-update


Bitcoin quick update: Bitcoin trend analysis (1st Dec 2016)

Bitcoin upward trend seems to be recovered to 743 level. Looking forward to $1000 level early 2017.

rdb-1-12-2016-marked

Since credit freezing is getting worst in China, it may be a factor to push up the bitcoin price. Just have quick look on the webbot report, Chinese property bubble would be in risk in early 2017.


Long term bitcoin trend analysis ($8,000 to $9,000 in September 2017)

To project the long-term trend of bitcoin price, I built up a bitcoin trend chart in log-scale to be the y-axis. The exponential equation shown on the diagram becomes a straight line. The R-Squared value is 0.7969 ~ 0.8. It is a value between 0 and 1. If the curve is very fit the data, the value will be near to 1. It means the trend of the bitcoin price develops in an exponential curve pattern. In this chart, it projects that bitcoin price will reach $8,000 to $9,000 in September 2017. It may reach over $12,000 in 2019.

long-span-btc-model-and-forecast

The explanation in English version

比特幣8000-9000美元一個?