Long term bitcoin trend analysis ($8,000 to $9,000 in September 2017)

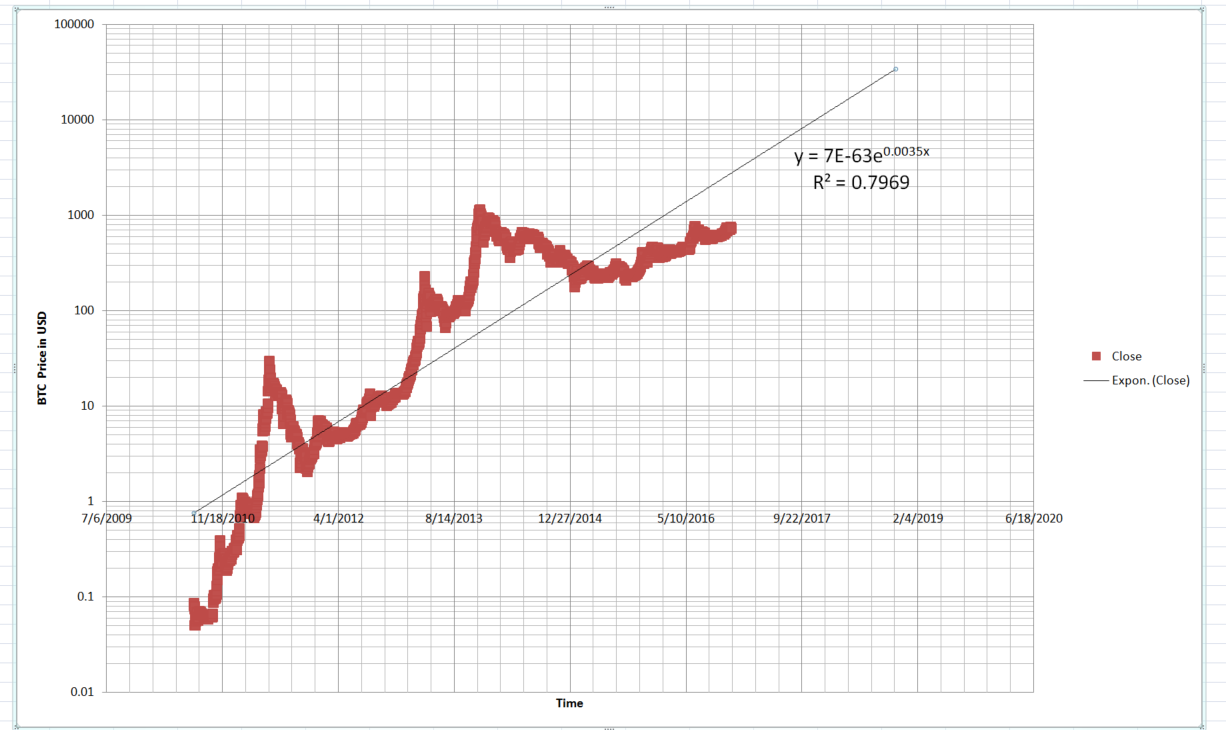
To project the long-term trend of bitcoin price, I built up a bitcoin trend chart in log-scale to be the y-axis. The exponential equation shown on the diagram becomes a straight line. The R-Squared value is 0.7969 ~ 0.8. It is a value between 0 and 1. If the curve is very fit the data, the value will be near to 1. It means the trend of the bitcoin price develops in an exponential curve pattern. In this chart, it projects that bitcoin price will reach $8,000 to $9,000 in September 2017. It may reach over $12,000 in 2019.

long-span-btc-model-and-forecast

The explanation in English version

比特幣8000-9000美元一個?


Author: Thomas

Hello, You may call me Thomas. I am from Hong Kong. I am a part-time lecturer for teaching university degree and a diploma in construction management and facilities management. I previously a research consultant in a public organization to forecast the workforce requirements for the whole city. Privately, I am an investor in Bitcoin, Physical Silver, and Gold. I am also studying alternative curing methods for health, world economics, UFO…etc

Leave a Reply

Your email address will not be published. Required fields are marked *