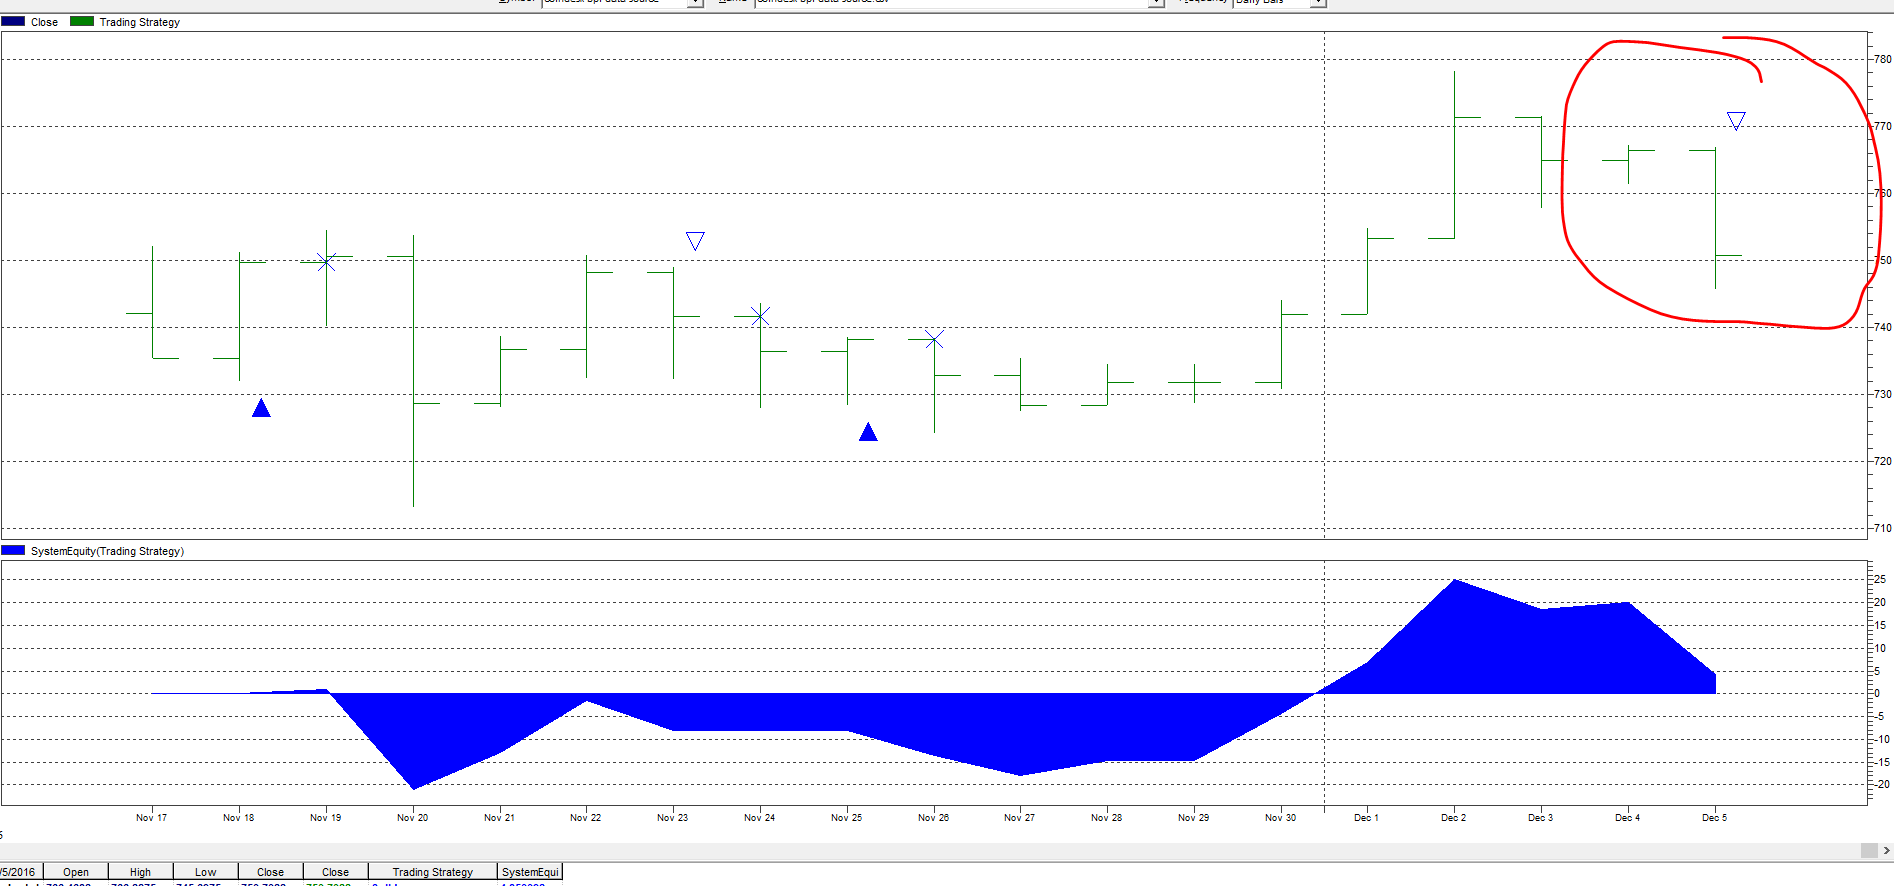
There is an EXIT signal for Robot Fighter “S”. The short term bitcoin trend is going down. The updated result are shown here.

Robot Dog “B” does not have any EXIT signal. It indicates that the mid-term upward trend still continues.
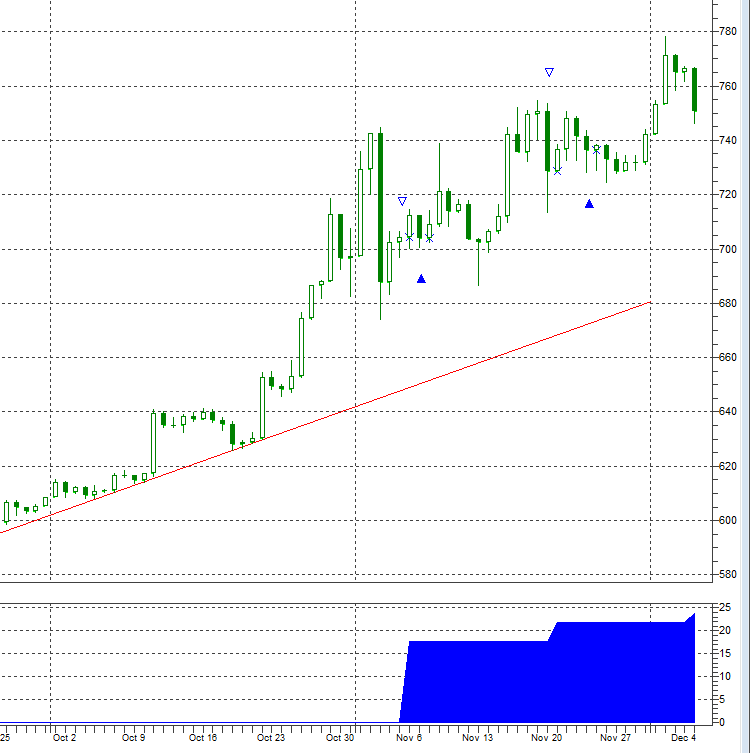

There is an EXIT signal for Robot Fighter “S”. The short term bitcoin trend is going down. The updated result are shown here.

Robot Dog “B” does not have any EXIT signal. It indicates that the mid-term upward trend still continues.


There is an important article which points out the purpose of the deep state to manipulate the India to ban the 1000 Rupee, and 500 Rupee cash is to suppress of demand of physical gold. Thanks for the writer of this article who pointed out this possible initiative of the action behind the India. India is a country who has a constant demand for physical gold. To ban the high-value paper cash will have a substantial impact on the demand for physical gold which can suppress the gold price. The spot price is following the COMEX gold transaction price. Unfortunately, 99% of transactions in COMEX are paper gold rather physical gold. The difference of price gold between Shanghai Golden exchange and US one is getting large from $10 to $20. Chinese do not agree on the price direction from US COMEX exchange because Chinese is now trading the physical GOLD contract rather than paper gold contract. The ratio between the physical GOLD and paper gold is over 250 in US market. Banks use the paper gold transactions to suppress the gold price. If the price breaks out the $1,500 range, it will go to $2,000, $5,000 and $50,000. The western banking system will blow out.
Therefore, to prevent the ignition of the fire in the insolvent banking system, a lot of paper future contracts are used to manipulate the price of gold and silver. Otherwise, the hyperinflation has already happened under the QE to infinity policy.
Bitcoin is a new market that a small proportion of people known what it is and how to invest on it. There is no future contract on bitcoin. The deep state cannot fully control the bitcoin’s price by the paper contract.
All physical GOLD, SILVER, and Bitcoin share the same characteristic of scarcity. They can store value under the QE to infinity and help people to escape the banking system – a safety heaven.
The deep state declared wars on bitcoin too. Coinbase dot com are required by the IRS to provide their records of previous three years. The bitlandngclub.com – a peer-to-peer loan platform was requested by the government to stop services. One bitcoin exchange in Hong Kong – bitfirst.com has cut their Hengsang bank (a sub-group of HSBC) account.
However, insolvency is insolvency. It is a mathematical certainty. The only uncertainty is when will this event happens. Whatever the deep state did, it is a matter of time.
All those tactics the deep state did are reflected that the day of the event is very near. Webbot ALTA report on December 2016 mentioned that there would have a big change after 12th Dec 2016. I checked the calendar-365.com. 13th Dec 2016 is the day of full moon.
Stankov believes that there some possible points we should take care.
1) China implements a massive one-off devaluation of the Yuan.
2) The $10 Trillion US Dollar carry trade blows up. (This is already happening now as the dollar is being repatriated after Trump’s victory. Note, George)
3) The $199 Trillion Bond Bubble implodes as debt deflation ripples through the financial system.
4) The $555 Trillion derivatives market based on interest rates ignites courtesy of a bond sell-off.
The final reminder for readers: keep your wealth out of the system.
Bitcoin upward trend seems to be recovered to 743 level. Looking forward to $1000 level early 2017.
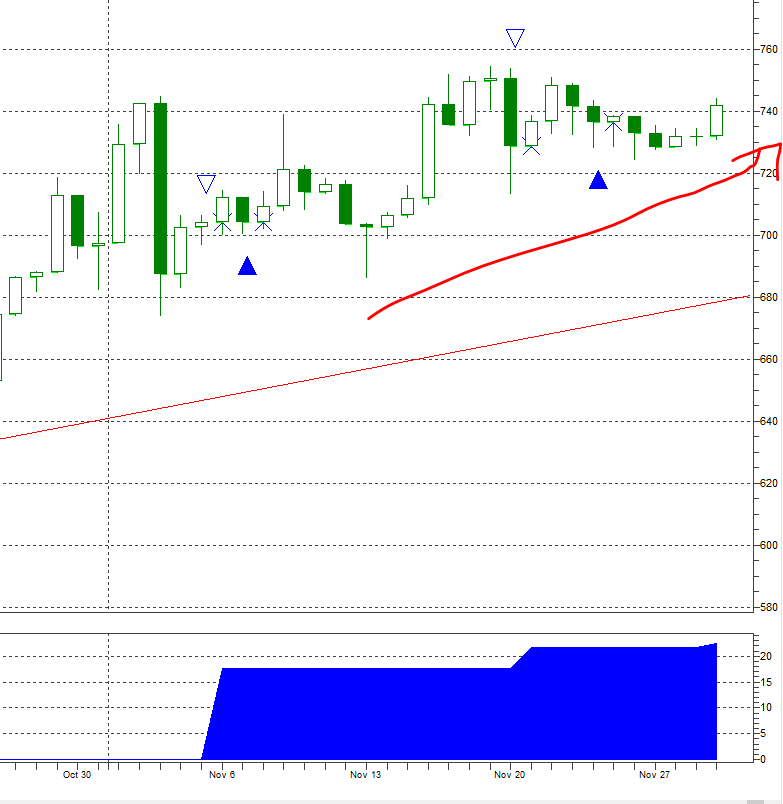
Since credit freezing is getting worst in China, it may be a factor to push up the bitcoin price. Just have quick look on the webbot report, Chinese property bubble would be in risk in early 2017.
In the bitcoin chart analysis, the Robot Fighter “S” generates a BUY signal today. See if it is a profitable trade.
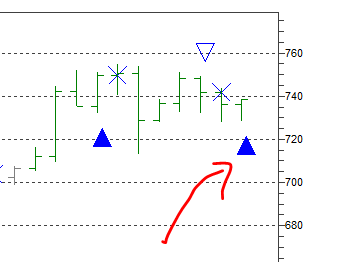
There is a BUY signal today. “B” confirmed the reversal point and the upward trend recaptured.
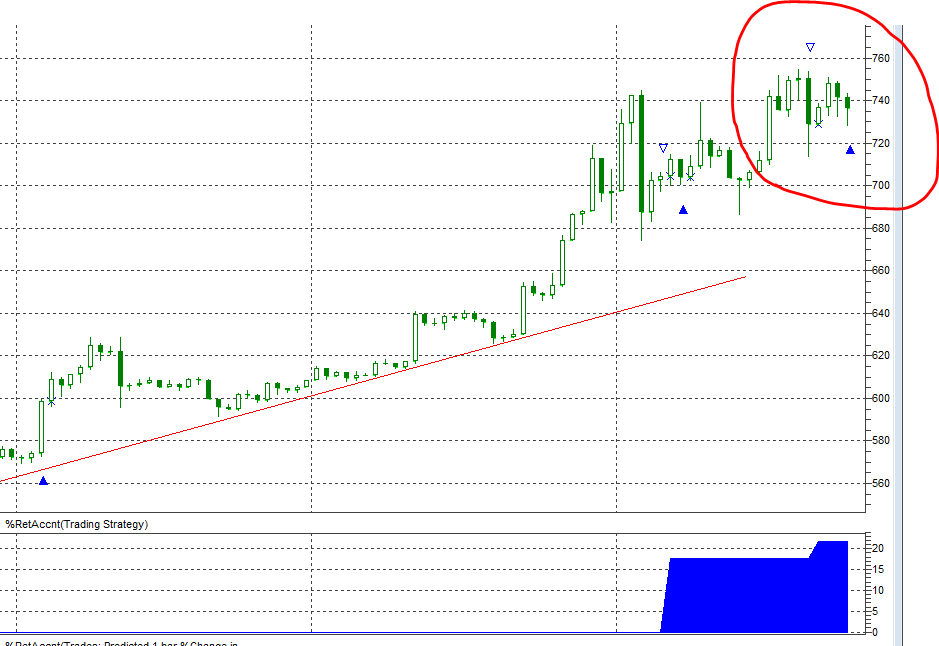
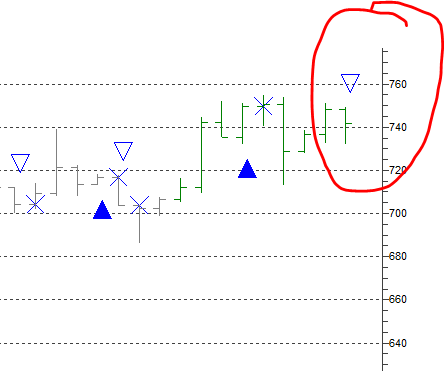
The bitcoin chart analysis for Robot Fighter “S” shows an EXIT Signal today. The current price of Bitcoin is $741

As shown in above table, -1.08% is recorded.
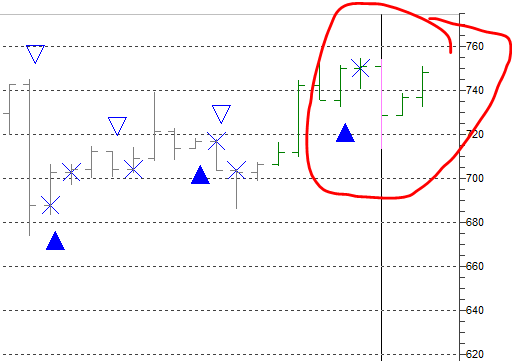
This was a BUY signal on 18.11.2016. The bitcoin price has a little correction from $750 to $720 level. The price has recovered today to $746, and there is no EXIT signal in these few days.
Video Explanation
English Video
Chinese Video
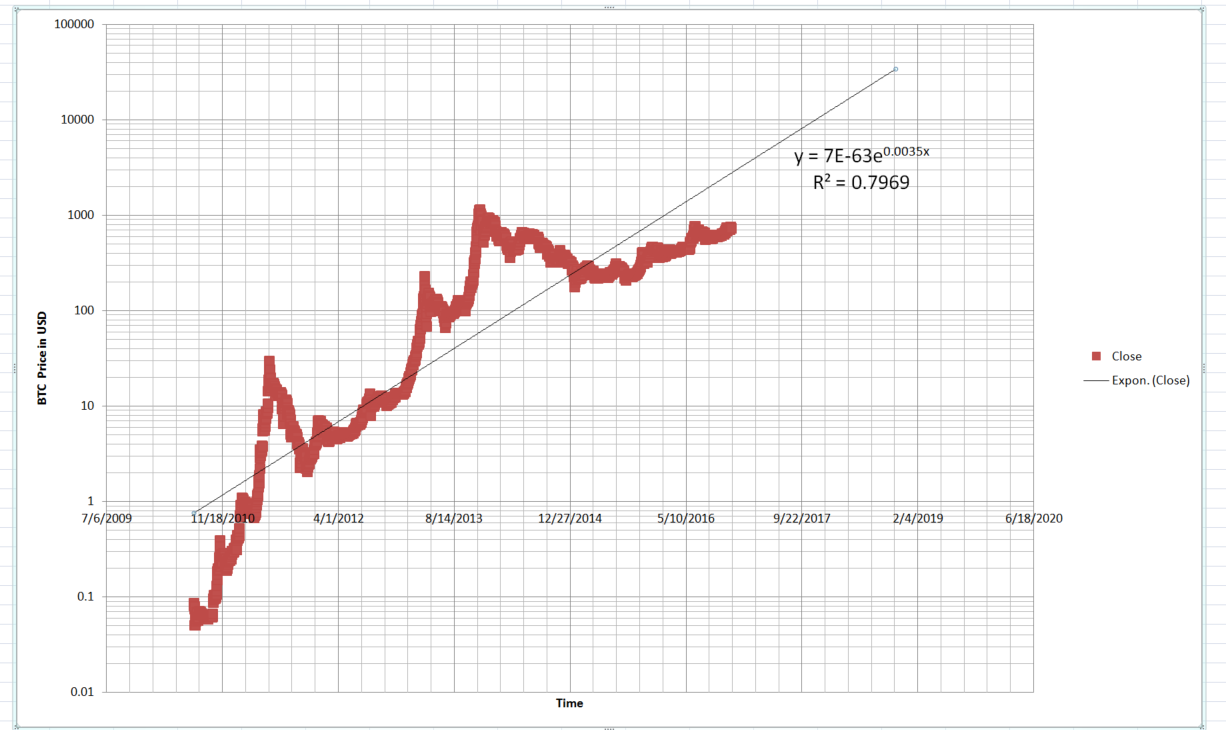
To project the long-term trend of bitcoin price, I built up a bitcoin trend chart in log-scale to be the y-axis. The exponential equation shown on the diagram becomes a straight line. The R-Squared value is 0.7969 ~ 0.8. It is a value between 0 and 1. If the curve is very fit the data, the value will be near to 1. It means the trend of the bitcoin price develops in an exponential curve pattern. In this chart, it projects that bitcoin price will reach $8,000 to $9,000 in September 2017. It may reach over $12,000 in 2019.
The explanation in English version
比特幣8000-9000美元一個?