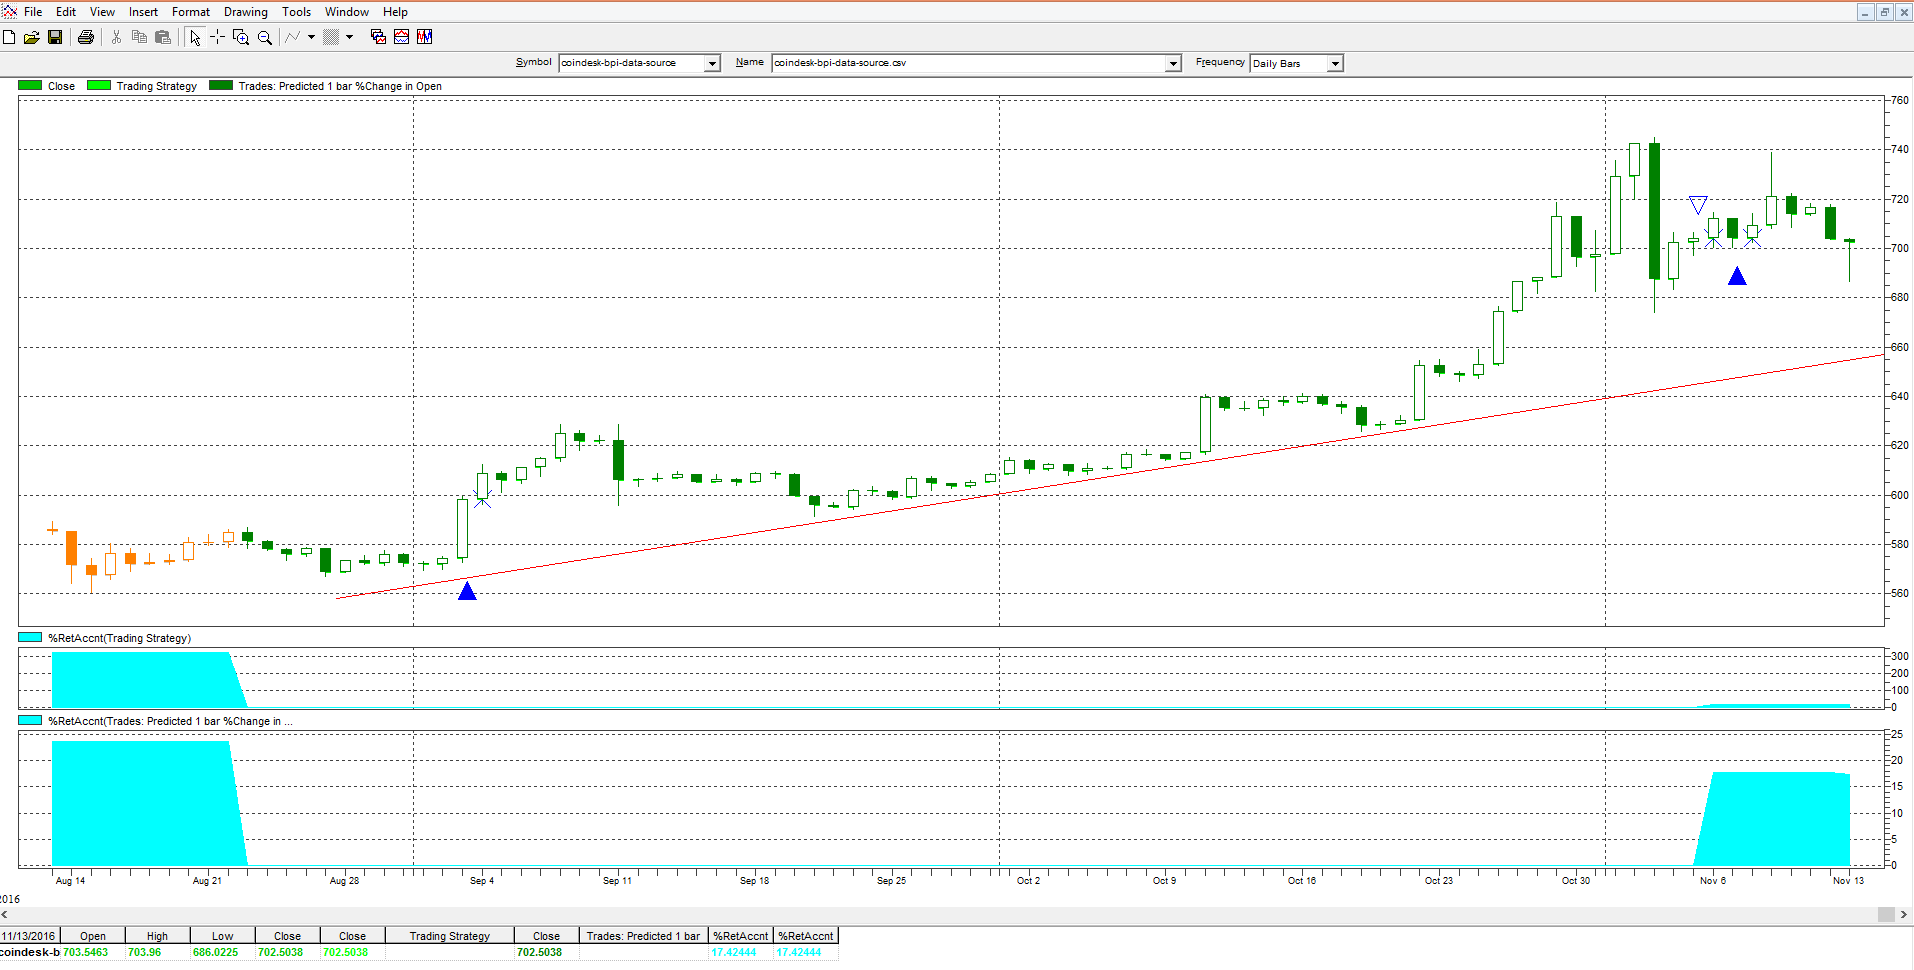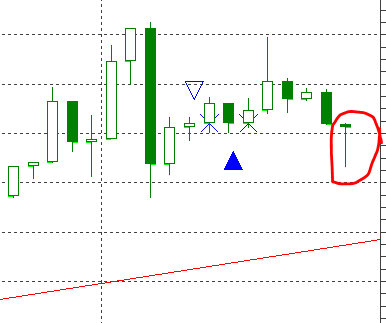
It is a zoomed bitcoin currency chart of Robot Dog “B” updated.

Yesterday, in the view of bitcoin chart analysis, BTC price drop and the candlestick signal of the last bar yesterday confirmed it selling pressure run out. It is a 90%-like a Dragonfly Doji pattern. It may imply a short-term market turning points.

The A.I. model (Robot Dog “B”) still maintains the BUY signal of 8th Nov 2016. I bet the upward trend still keeps in mid-term and now is the short-term low.
Author: Thomas
Hello, You may call me Thomas. I am from Hong Kong. I am a part-time lecturer for teaching university degree and a diploma in construction management and facilities management. I previously a research consultant in a public organization to forecast the workforce requirements for the whole city. Privately, I am an investor in Bitcoin, Physical Silver, and Gold. I am also studying alternative curing methods for health, world economics, UFO…etc
View all posts by Thomas


